Building relationships: the SQL

In the beginning of May Tableau released version 2020.2 of Tableau Desktop, featuring a brand new data model. At the time of the release, we showed in the post “Building relationships: Tableau’s new data model”, how relationships make data combination easier, faster, more flexible and more powerful, when compared to traditional blends or joins. The focus of this post is to dive deeper into the performance aspect, and show that when using relationships we query only the part of the data model being used in the visualization. This contrasts with joins, where the entire data model is queried when we use any element of the data model in our visualization.
Today we will use Tableau’s Performance Recording feature to explore this topic. The Performance Recorder is an extremely powerful tool that records information about key events as you interact with your Tableau visualizations. It is typically used to analyze and troubleshoot the performance of dashboards. Here we will use it to show what happens behind the scenes when data is combined in Tableau. In particularly, we will look into the SQL queries put together by Tableau to retrieve the data.
If you would like to follow along you can sign-up for a free trial of Tableau Desktop. We will be using the Bookshop dataset, which was created by Tableau to showcase the capabilities of the new data model. The raw data can be downloaded as an xlsx file.
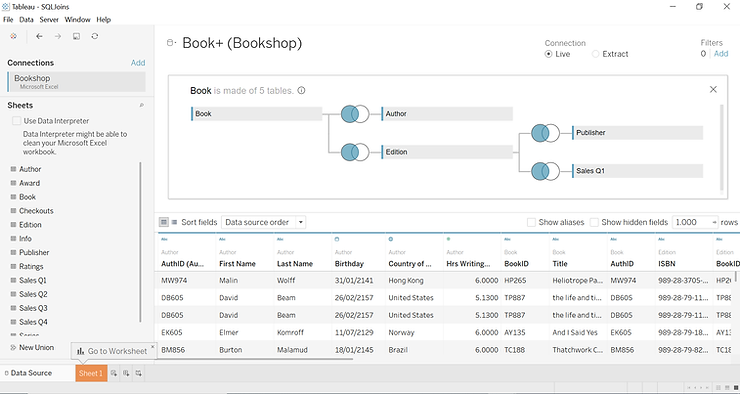
The Bookshop dataset consists of 13 tables, which should be combined as shown in this image. For simplicity later on, we will only use five of them. Start by connecting Tableau Desktop to the Bookshop.xlsx file and drag the tables on left to the canvas to form the following relationships:
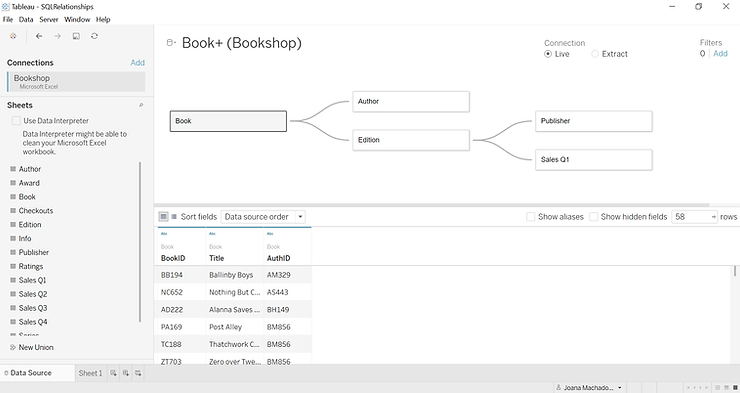
Notice we are already benefiting hugely from relationships. We were able to put together a complex data source made up of five different tables in a few seconds. Furthermore, we still do not know which viz we are going to build, but we can be confident that this source will serve any viz we might want to put together.
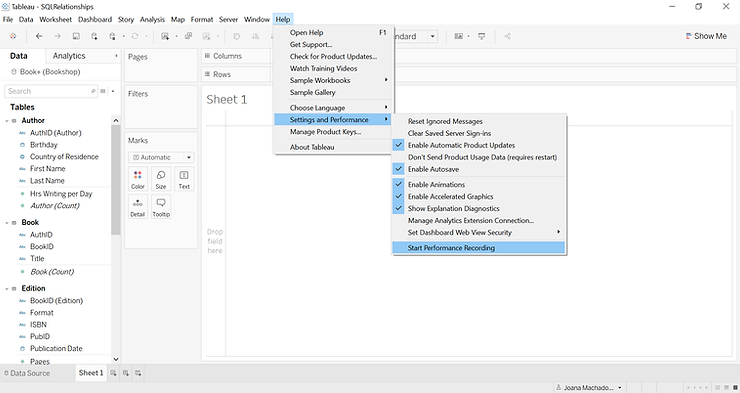
In a new worksheet we can enable the Performance Recorder right away, by going to Help > Settings and Performance > Start Performance Recording:
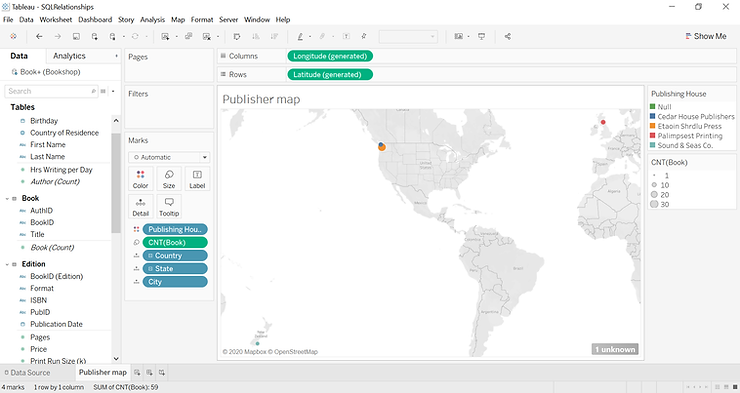
With the performance recording enabled, let us now build a simple viz – a map showing the location (city) of the publishing houses (color) and a count of the books (the count of the table Book) for each (size):
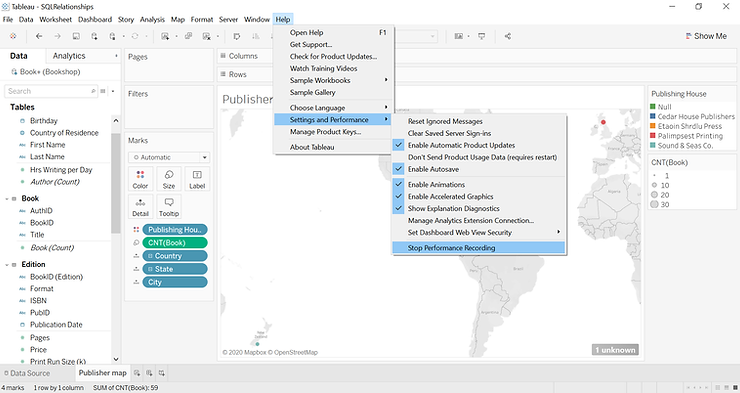
Once we finish we can stop the performance recording - Help > Settings and Performance > Stop Performance Recording:
After a few seconds, a new read-only workbook, named PerformanceRecording, should appear in your screen. This workbook is produced automatically by Tableau and contains data collected by the performance recorder.
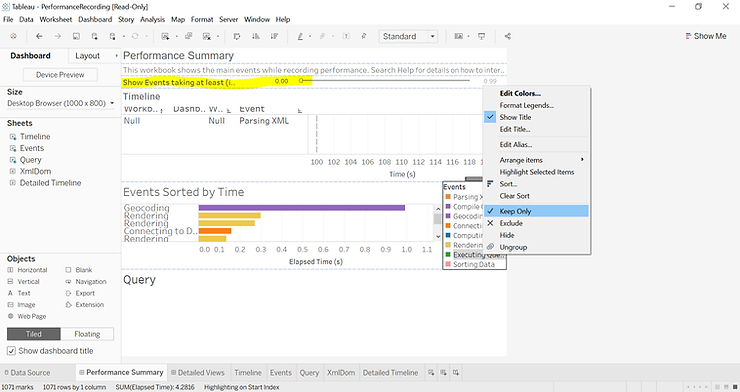
There is a lot of information in this workbook, but for now we are only interested in the SQL queries that Tableau submitted to the data source. So, first of all, let us remove the lower bound on the “Show Events taking at least (in seconds)” filter. Then we can select events in the “Executing Query” category only:
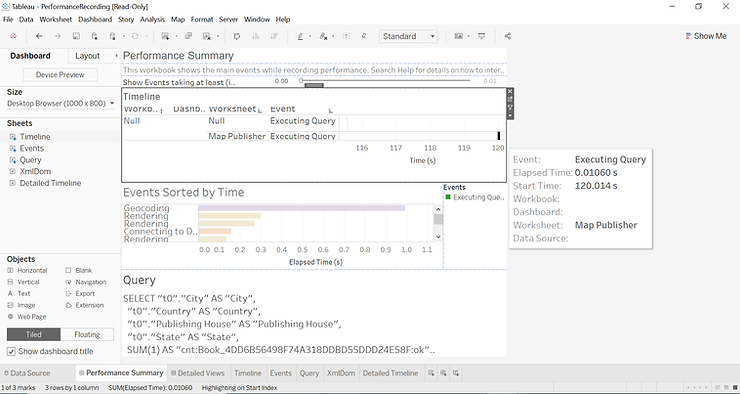
Finally, we can click on the last event in the timeline (the one associated with our “Publisher Map” worksheet), which should cause SQL query associated with this event to appear at the bottom:
For reference, here is the complete SQL query:
SELECT "t0"."City" AS "City",
	"t0"."Country" AS "Country",
    "t0"."Publishing House" AS "Publishing House",
    "t0"."State" AS "State",
    SUM(1) AS "cnt:Book_4DD6B56498F74A318DDBD55DDD24E58F:ok"
FROM "TableauTemp"."Book$" "Book"
	INNER JOIN (
		SELECT
    		"Book"."BookID" AS "BookID",
    		"Publisher"."City" AS "City",
        	"Publisher"."Country" AS "Country",
        	"Publisher"."Publishing House" AS "Publishing House",
        	"Publisher"."State" AS "State"
    	FROM "TableauTemp"."Book$" "Book"
    		LEFT JOIN "TableauTemp"."Edition$" "Edition"
    		ON ("Book"."BookID" = "Edition"."BookID")
    		LEFT JOIN "TableauTemp"."Publisher$" "Publisher"
    		ON ("Edition"."PubID" = "Publisher"."PubID")
    	GROUP BY 1, 2, 3, 4, 5
    ) "t0"
	ON ("Book"."BookID" IS NOT DISTINCT FROM "t0"."BookID")
GROUP BY 1, 2, 3, 4
For the purpose of this exercise, let us focus on which table are actually being queried: Book, Publisher and Edition. So out of the five tables that were initially related, only the three that contain data relevant to our viz appear in the SQL query. Furthermore, notice how Tableau decided on which types of joins to implement, we did not have to choose these in advance.
We can now repeat the exercise in a new workbook, but this time we will join the five tables, instead of creating relationships between them. Remember, you can still create joins by accessing a table’s physical layer. So once you drag the Books table into the canvas on the left be sure to double-click it to create the joins. Here we opted for left joins throughout:
Once you go through all the motions, this is the SQL query you will see in the new PerformanceRecording workbook:
SELECT "Publisher"."City" AS "City",
	"Publisher"."Country" AS "Country",
	"Publisher"."Publishing House" AS "Publishing House",
	"Publisher"."State" AS "State", SUM(1) AS "cnt:Book_7574EAB3E16C49EFB49807BEEF2AF0C1:ok"
FROM "TableauTemp"."Book$" "Book"
	LEFT JOIN "TableauTemp"."Author$" "Author"
	ON ("Book"."AuthID" = "Author"."AuthID")
	LEFT JOIN "TableauTemp"."Edition$" "Edition"
	ON ("Book"."BookID" = "Edition"."BookID")
	LEFT JOIN "TableauTemp"."Publisher$" "Publisher"
	ON ("Edition"."PubID" = "Publisher"."PubID")
	LEFT JOIN "TableauTemp"."'Sales Q1$'" "Sales Q1"
	ON ("Edition"."ISBN" = "Sales Q1"."ISBN")
GROUP BY 1, 2, 3, 4
Again, we are mostly interested in the tables being queried, which in this case is all five of them – Book, Author, Edition, Sales Q1 and Publisher. With joins, the data is combined in advance. Therefore, you see join statements for all five tables, even if we are not getting data from the Sales Q1 or Author tables.
You might have also noticed that, dragging the Book (Count) field to size does not give you the same numbers as before. With relationships, each table maintains its native level of detail. This means we can use the dedicated Book table count in the viz and get the right answer. However, joining tables with different levels of detail leads to duplicate records, which is why the count is inflated.
This exercise highlights the power of relationships, where the combinations is dynamic and adjusts to your viz. This greatly improving the flexibility of your data sources and the performance of your dashboards. If you would like to give relationships a try, you can sign-up for a free trial of Tableau Desktop.
In the beginning of May Tableau released version 2020.2 of Tableau Desktop, featuring a brand new data model. At the time of the release, we showed in the post “Building relationships: Tableau’s new data model”, how relationships make data combination easier, faster, more flexible and more powerful, when compared to traditional blends or joins. The focus of this post is to dive deeper into the performance aspect, and show that when using relationships we query only the part of the data model being used in the visualization. This contrasts with joins, where the entire data model is queried when we use any element of the data model in our visualization.
Today we will use Tableau’s Performance Recording feature to explore this topic. The Performance Recorder is an extremely powerful tool that records information about key events as you interact with your Tableau visualizations. It is typically used to analyze and troubleshoot the performance of dashboards. Here we will use it to show what happens behind the scenes when data is combined in Tableau. In particularly, we will look into the SQL queries put together by Tableau to retrieve the data.
If you would like to follow along you can sign-up for a free trial of Tableau Desktop. We will be using the Bookshop dataset, which was created by Tableau to showcase the capabilities of the new data model. The raw data can be downloaded as an xlsx file.
The Bookshop dataset consists of 13 tables, which should be combined as shown in this image. For simplicity later on, we will only use five of them. Start by connecting Tableau Desktop to the Bookshop.xlsx file and drag the tables on left to the canvas to form the following relationships:
Notice we are already benefiting hugely from relationships. We were able to put together a complex data source made up of five different tables in a few seconds. Furthermore, we still do not know which viz we are going to build, but we can be confident that this source will serve any viz we might want to put together.
In a new worksheet we can enable the Performance Recorder right away, by going to Help > Settings and Performance > Start Performance Recording:
With the performance recording enabled, let us now build a simple viz – a map showing the location (city) of the publishing houses (color) and a count of the books (the count of the table Book) for each (size):
Once we finish we can stop the performance recording - Help > Settings and Performance > Stop Performance Recording:
After a few seconds, a new read-only workbook, named PerformanceRecording, should appear in your screen. This workbook is produced automatically by Tableau and contains data collected by the performance recorder.
There is a lot of information in this workbook, but for now we are only interested in the SQL queries that Tableau submitted to the data source. So, first of all, let us remove the lower bound on the “Show Events taking at least (in seconds)” filter. Then we can select events in the “Executing Query” category only:
Finally, we can click on the last event in the timeline (the one associated with our “Publisher Map” worksheet), which should cause SQL query associated with this event to appear at the bottom:
For reference, here is the complete SQL query:
SELECT "t0"."City" AS "City",
	"t0"."Country" AS "Country",
    "t0"."Publishing House" AS "Publishing House",
    "t0"."State" AS "State",
    SUM(1) AS "cnt:Book_4DD6B56498F74A318DDBD55DDD24E58F:ok"
FROM "TableauTemp"."Book$" "Book"
	INNER JOIN (
		SELECT
    		"Book"."BookID" AS "BookID",
    		"Publisher"."City" AS "City",
        	"Publisher"."Country" AS "Country",
        	"Publisher"."Publishing House" AS "Publishing House",
        	"Publisher"."State" AS "State"
    	FROM "TableauTemp"."Book$" "Book"
    		LEFT JOIN "TableauTemp"."Edition$" "Edition"
    		ON ("Book"."BookID" = "Edition"."BookID")
    		LEFT JOIN "TableauTemp"."Publisher$" "Publisher"
    		ON ("Edition"."PubID" = "Publisher"."PubID")
    	GROUP BY 1, 2, 3, 4, 5
    ) "t0"
	ON ("Book"."BookID" IS NOT DISTINCT FROM "t0"."BookID")
GROUP BY 1, 2, 3, 4
For the purpose of this exercise, let us focus on which table are actually being queried: Book, Publisher and Edition. So out of the five tables that were initially related, only the three that contain data relevant to our viz appear in the SQL query. Furthermore, notice how Tableau decided on which types of joins to implement, we did not have to choose these in advance.
We can now repeat the exercise in a new workbook, but this time we will join the five tables, instead of creating relationships between them. Remember, you can still create joins by accessing a table’s physical layer. So once you drag the Books table into the canvas on the left be sure to double-click it to create the joins. Here we opted for left joins throughout:
Once you go through all the motions, this is the SQL query you will see in the new PerformanceRecording workbook:
SELECT "Publisher"."City" AS "City",
	"Publisher"."Country" AS "Country",
	"Publisher"."Publishing House" AS "Publishing House",
	"Publisher"."State" AS "State", SUM(1) AS "cnt:Book_7574EAB3E16C49EFB49807BEEF2AF0C1:ok"
FROM "TableauTemp"."Book$" "Book"
	LEFT JOIN "TableauTemp"."Author$" "Author"
	ON ("Book"."AuthID" = "Author"."AuthID")
	LEFT JOIN "TableauTemp"."Edition$" "Edition"
	ON ("Book"."BookID" = "Edition"."BookID")
	LEFT JOIN "TableauTemp"."Publisher$" "Publisher"
	ON ("Edition"."PubID" = "Publisher"."PubID")
	LEFT JOIN "TableauTemp"."'Sales Q1$'" "Sales Q1"
	ON ("Edition"."ISBN" = "Sales Q1"."ISBN")
GROUP BY 1, 2, 3, 4
Again, we are mostly interested in the tables being queried, which in this case is all five of them – Book, Author, Edition, Sales Q1 and Publisher. With joins, the data is combined in advance. Therefore, you see join statements for all five tables, even if we are not getting data from the Sales Q1 or Author tables.
You might have also noticed that, dragging the Book (Count) field to size does not give you the same numbers as before. With relationships, each table maintains its native level of detail. This means we can use the dedicated Book table count in the viz and get the right answer. However, joining tables with different levels of detail leads to duplicate records, which is why the count is inflated.
This exercise highlights the power of relationships, where the combinations is dynamic and adjusts to your viz. This greatly improving the flexibility of your data sources and the performance of your dashboards. If you would like to give relationships a try, you can sign-up for a free trial of Tableau Desktop.